Int Lung, Effusion and Consolidation
To visualize pulmonary edema and effusion you need to use a probe that can penetrate deeper structures and the linear probe may not be your best fit. Use the curvilinear probe (1-8MHz) that allows you to visualize deeper structures at the expense of resolution. You could also use phase array transducers used in cardiac imaging (2-8MHz).
Alveolar Interstitial Syndrome
B-lines
B-lines are reverberation artifacts that appear as hyperechoic vertical lines that extend from the pleura to the edge of the screen without fading. These are vertical in orientation. A few B-lines less than or equal to 2 in each interrogation zone is considered normal. These lines move in synchrony with lung sliding.
These artifacts are characteristic of pulmonary edema or any process that infiltrates the interstitium of the lung. Their presence is strongly correlated with alveolar or interstitial abnormalities seen on CT scan.
We can appreciate B lines in the images below. On the left, multiple B-lines in a single scan segment. On the right, the curtain sign as described in the prior segment. If you look closely between the rib shadows you can observe the pleural line moving. The pleural line looks thin and continuous and you see faint B-Lines that are 2 at most on that segment.


B lines. The normal expected number of B lines is less than 2 per scan line. We appreciate more than that amount on the scan on the left. On the right the Lung curtain with less 2 faint B-lines as the pleural line comes between two rib shadows.
Interstitial Lung Disease
Lung ultrasound is a reliable tool to evaluate diffuse parenchymal lung disease. When 3 or more B-lines are present on the scan consider interstitial lung disease. Depending on the disease process causing this artefact these may be local or general. Remember that B lines are defined as discrete laser-like vertical hyperechoic reverberation artifacts that arise from the pleural line (previously described as ‘‘comet tails’’), extend to the bottom of the screen without fading, and move synchronously with lung sliding.
In patients with diffuse parenchymal lung disease (pulmonary fibrosis), the distribution of B-lines correlates with computed tomography (CT) signs of fibrosis. Bear in mind that the sonographic technique consists of evaluating eight lung regions and that a positive region is defined by the presence of three or more B lines in a longitudinal plane between two ribs. A positive exam for interstitial syndrome involves findings in two or more lung regions.
Lung ultrasound is superior to conventional chest radiography for ruling in significant interstitial syndrome. A negative lung ultrasound is superior to chest X-ray in ruling out significant interstitial syndrome
Sonographic findings that are suggestive of acute respiratory distress syndrome (ARDS) and not cardiogenic pulmonary edema include the following:
1. Anterior subpleural consolidations.
2. Absence or reduction of lung sliding.
3. Areas with normal parenchyma or ‘‘spared areas’’
4. Pleural line abnormalities (irregular thickened fragmented pleural line)
5. Nonhomogeneous distribution of B-lines
Sonographic findings indicative of diffuse parenchymal lung disease (pulm fibrosis) and not cardiogenic pulmonary edema involve:
1. Pleural line abnormalities (irregular, fragmented pleural line)
2. Subpleural abnormalities.
3. B-lines in a nonhomogeneous distribution.
Pulmonary Edema
In this image:
1. More than 3 B lines in this particular scanning plane.
2. The pleural line does not seem disrupted and there is no subpleural abnormalities.
3. If this is a finding throughout the lung the patient is likely experiencing pulmonary edema
Consider ARDS if:
1. Non dependent fields: Bilateral B-lines that non-homogeneous. This means that B-lines are numerous, confluent in another and areas of normal lung (lung sliding and A-lines).
2. Dependent lung fields: B-lines are homogeneous with coalescent B-lines and areas of consolidation especially at the bases. Lung sliding is absent or reduced in areas of coalescent B-lines. The pleural line is also irregular.

ARDS vs Pnuemonia vs Pulmonary Fibrosis
In this image:
1. More than 3 B lines in this particular scanning plane.
2. The B-lines appear confluent and a significant portion of the scanning sector is occupied by this artifact.
3.There is disruption of the pleural line.
4.There is a subpleural abnormality in the middle of the sector being scanned.
Consider ARDS if the findings here correspond to
dependent lung fields: B-lines are homogeneous with coalescent B-lines and areas of consolidation especially at the bases. The pleural line is also irregular.

COVID Pneumonia
In this image:
1. More than 3 B lines in this particular scanning plane.
2. The B-lines appear confluent and a significant portion of the scanning sector is occupied by this artifact. This is sometimes called Waterfall effect.
3. There is disruption of the pleural line and it appears thickened.
4. The is subpleural consolidation.
5. Image collected from a linear probe.
Image courtesy of the POCUS Atlas

Aspiration PNA vs ARDS
In this image we see:
1. More than 3 B lines in this particular scanning plane.
2. The B-lines appear confluent.
3. Disruption of the pleural line.
4. If this is a focal finding it is likely pneumonia. If there are areas that are spared consider ARDS.
Consider ARDS if:
Non dependent fields: Bilateral B-lines that non-homogeneous. This means that B-lines are numerous, confluent in another and areas of normal lung (lung sliding and A-lines).
Dependent lung fields: B-lines are homogeneous with coalescent B-lines and areas of consolidation especially at the bases. Lung sliding is absent or reduced in areas of coalescent B-lines. The pleural line is also irregular.

Tuberculosis
In this image:
1. More than 3 B lines in these 2 particular scanning planes.
2. The origin of a single B line casts 3 other B lines (tripartite) seen better on the image to the left.
3. Disruption of the pleural line (seen clearly on the image to the right and next to the rib).


Cardiogenic Pulmonary Edema vs Others
It is important to keep in mind that the lung exam encompasses examining 8 lung regions to have an overall grasp of the potential pathologies. Multiple B lines does not always imply pulmonary edema and thus it is important to evaluate its a local or diffuse finding:
Focal multiple B lines may indicate the following:
1. Pneumonia or pneumonitis
2. Atelectasis
3. Pulmonary contusion
4. Pulmonary infarction
5. Pleural disease
6. Neoplasia
Diffuse bilateral B lines indicate interstitial syndrome. The differential diagnosis include:
1. Pulm Edema
2. Intersitial pneumonia or pneumonitis
3. Diffuse parenchymal lung disease (pulmonary fibrosis).
Pleural Effusion
As fluid accumulates in a dependent fashion interrogation of the lower lobes is necessary. Start with the mid to posterior axillary line. The sonographer should attempt at visualizing the diaphragm which will be the most dependent are of the lung.
Pleural effusions as small as 3-5mm can be detected using US. Pleural US is superior to standard chest x ray in detecting pleural effusions.
As the lung tissue appears compressed by fluid around it, atelectasis develops and on US the term hepatization is coined since it appears with the same density as that of the liver. The lung can also appear floating in the chest a.k.a jellyfish sign. Finally the presence of fluid makes visualization of the thoracic spine easy to see. This is called spine sign which in normal circumstances we would not be able to see.
If the measured distance from the pleura to lung tissue is >5cm , there is at least 500cc of pleural fluid in the cavity


Pleural effusion seen on these two clips. The liver is seen in both and just above it, a large anechoic pleural effusion. On the image above we can see an atelectatic right lung floating in the fluid. Spine sign is present in both as a result of enhancement artifact. Under normal circumstances we should not be able to visualize the spine and can do so because of the fluid collection, hence the name Spine sign.
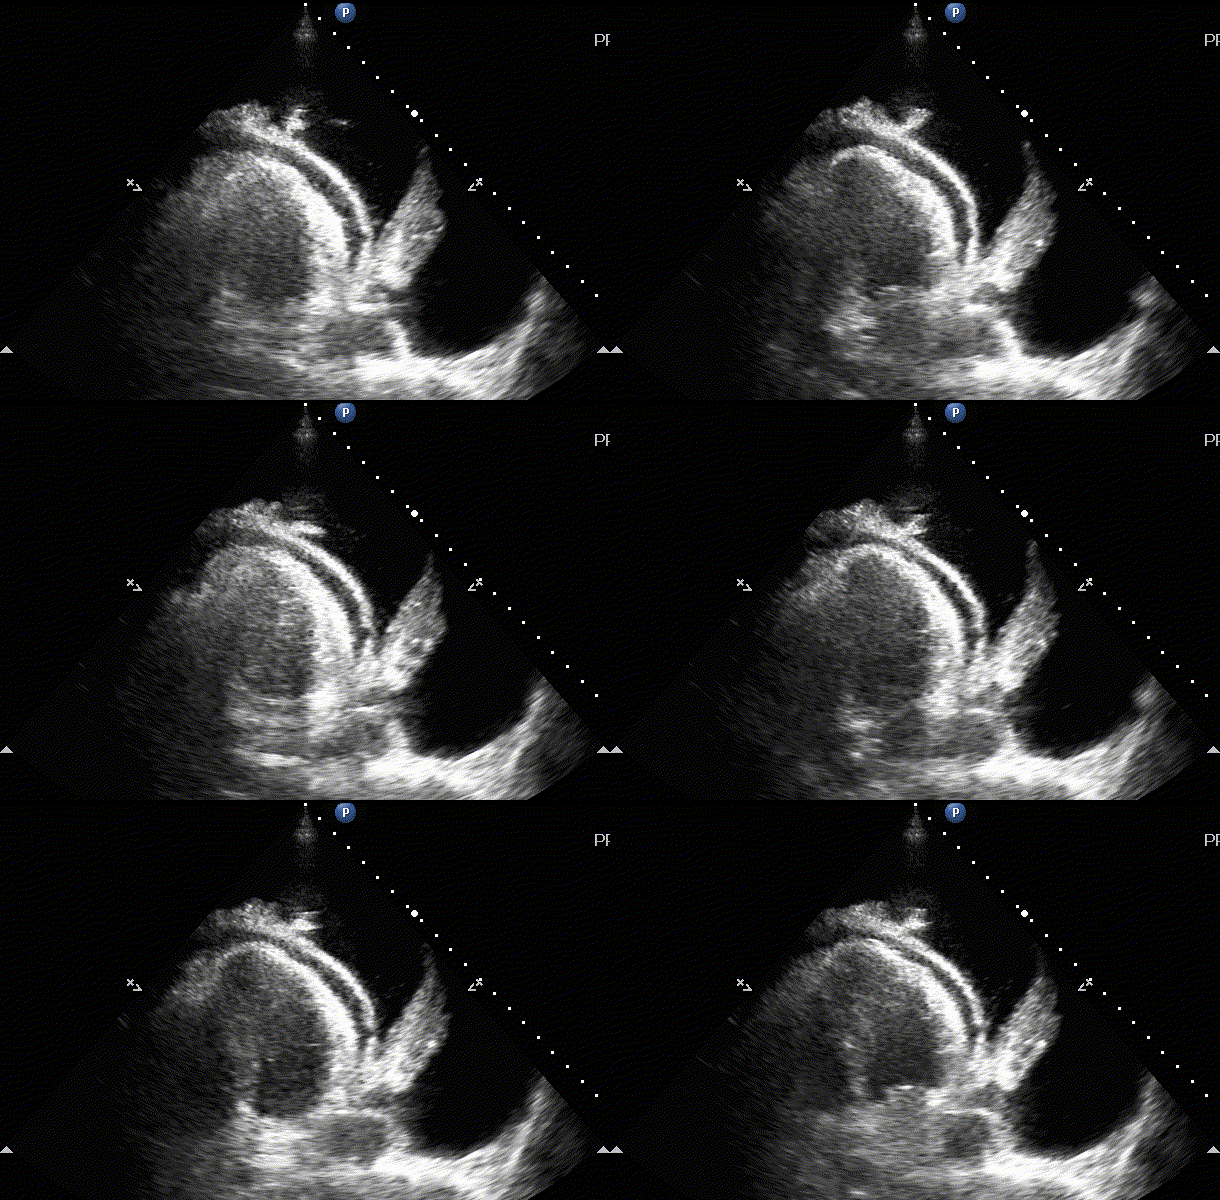
On examination of the heart the sonographer can also visualize pleural effusion on the left side of the chest. This is typically seen in the Parasteral Long axis view of the heart. If the fluid is accumulated below the descending thoracic aorta this is pleural. If the fluid is above the aorta then it is pericardial.


Pleural and pericardial effusion on the image to the left. On the right we appreciate a large pleural effusion and we can see the thoracic spine (spine sign) because of acoustic enhancement (artifact explained on the physics lecture)
Lung Consolidation
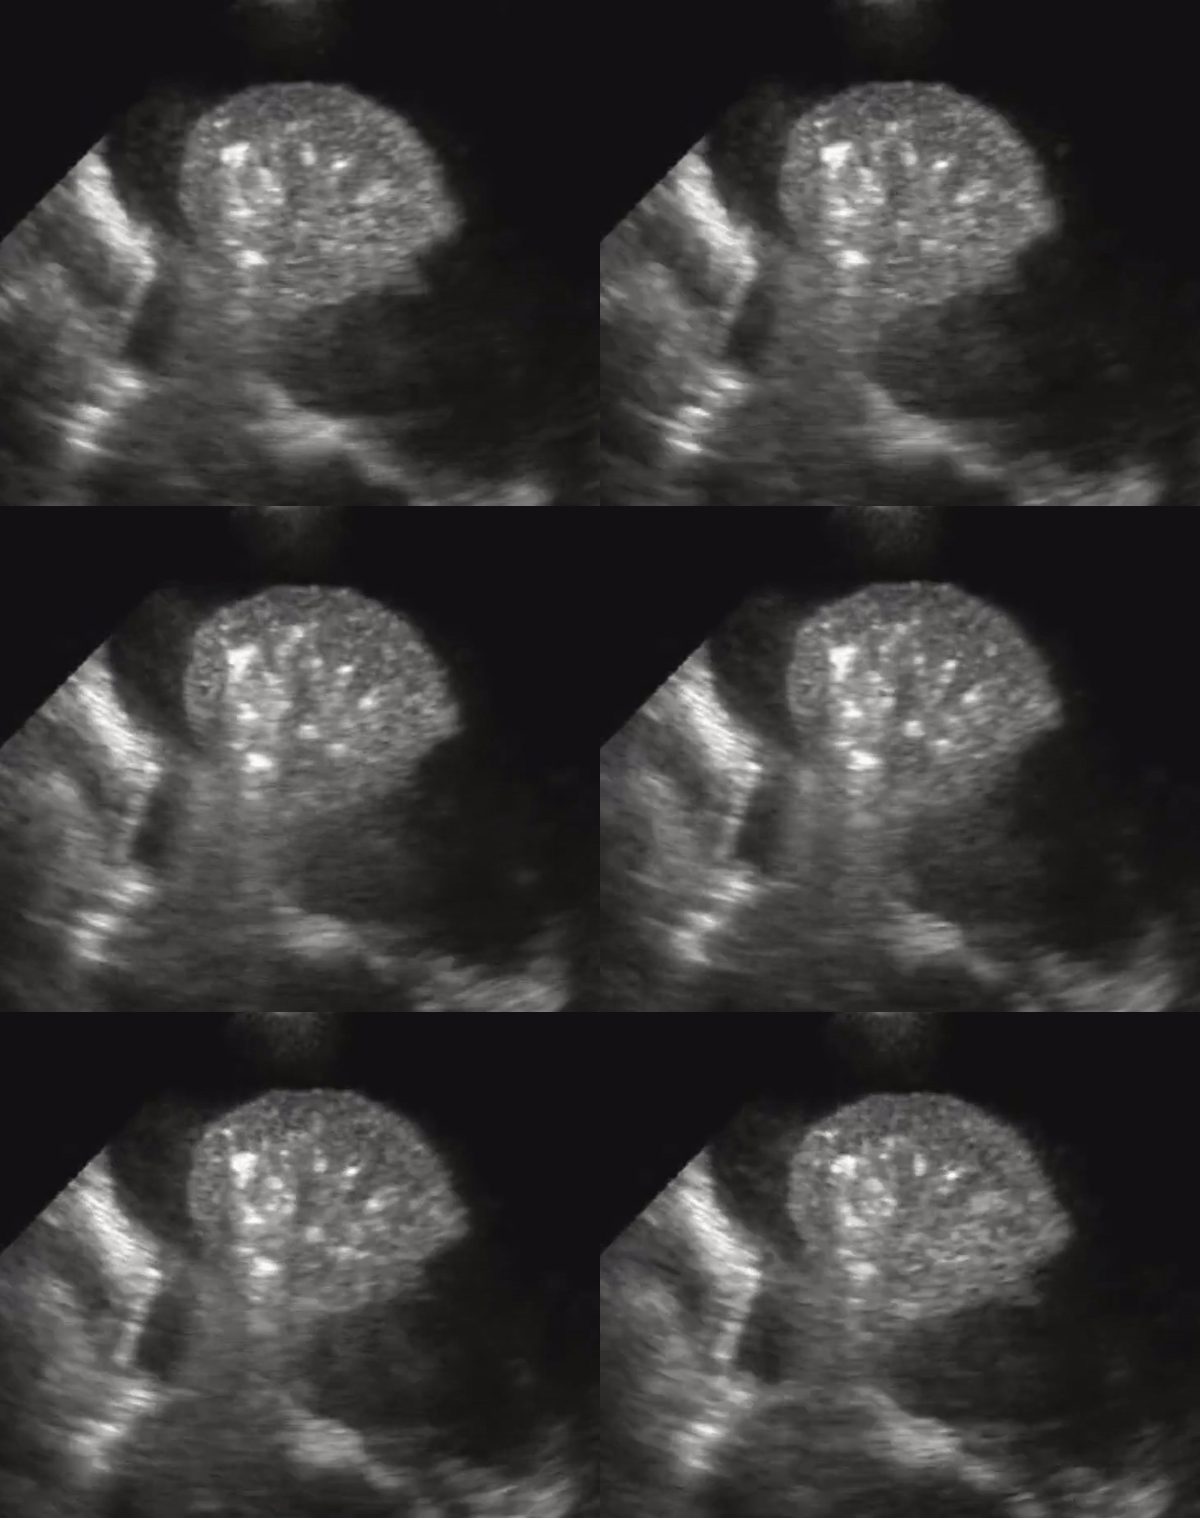
A lung that has consolidation is a lung that is dense and allows us to see it under US. The lung appears with equal echogenicity as that of the liver and thus referred to as hepatization of the lung. If there bronchial structures that supply the affected lung are patent, there may be air bronchograms within it. All causes of infiltrative process or severe pneumonia with complete filling of the alveolar compartment will yield complete filling of the alveolar compartment.


Consolidation with complete filling of the alveolar compartment. Air bronchograms appear as hyperechoic (white) structures on the lung parenchyma. On the right we also appreciate pleural effusion.
References for the LUNG chapter including pathology:
1. Gargani L, Volpicelli G. How I do it: lung ultrasound. Cardiovasc Ultrasound. 2014;12:25. Published 2014 Jul 4. doi:10.1186/1476-7120-12-25
2. Volpicelli G and all. International evidence-based recommendations for point-of-care ultrasound. Intensive Care Med. 2012 Apr;38(4):577-91.doi: 10.1007/s00134-012-2513-4. Epub 2012 Mar 6.
3. Mayo, P.H., Copetti, R., Feller-Kopman, D. et al. Thoracic ultrasonography: a narrative review. Intensive Care Med 45, 1200–1211 (2019). https://doi.org/10.1007/s00134-019-05725-8
